Fitness Dashboard with Google Fit
In this post, I will describe my Google Sheets dashboard, where I track all fitness-related aspects.
I like self-tracking. I want to track my productivity and find potential improvements. What gets tracked also gets measured. My interest in the Quantified self has evolved.
I started with Gamification of Life, where I assigned points to everything I did. It got too overwhelming after a year.
I lack at maintaining relationships with friends and family. For insights, I analysed my chats’ metadata - Chatting Up and Chatting Up - Part II. It was interesting to see how my interactions changed over time with friends. I also wanted to play with the chat content, but NLP capabilities at that time weren’t enough to deal with Hinglish text.
I track my call logs and someday would like to analyse them.
Two years back, I even started making an app to track anything. You can read more about the app here:
- Minutes - A Quantified Self App for Myself
- Minutes - Building the Settings Page
- Minutes - Building the History Page
Eventually, other commitments and curiosities caught up, and I couldn’t finish it. 😅
I also track my spending and habits. I am sure I have skipped a few more.
Tracking Fitness
Fitness was another frontier where I tried many things. Tracking was always enabled using Google Fit and Maps, but I did not do anything with the data. Google Fit analytics on the app was helpful, but I wanted more. Time was difficult to find between work, travel, and other interests. I wanted something quick and easy to develop/maintain.
Introducing: Do More With Less (DMWL). It is a trend at work where you identify and prioritize the tasks that are quick to execute with good ROI.
I googled previous work in this direction. I found this medium article that pointed to this more helpful article doing what I wanted - Export Google Fit Daily Steps, Weight and Distance to a Google Sheet[code from the blog is available here: google-fit-to-sheets/Code.gs]. It made almost everything straightforward - setting up the app, auth, pulling and formatting data. Chat GPT complemented my lack of knowledge of Javascript to write code in Google Sheets.
Update: 19th July
I had to do set up the credentials multiple times now. Add the steps here so quick reference. In depth instructions are on apps-script-oauth2/README.md.
- Open script editor by going to Extensions > Apps Scrip. It will open a new apps script project.
- Name the project. Click the + in the Libraries section. In the Add a Library dialogue, add
1B7FSrk5Zi6L1rSxxTDgDEUsPzlukDsi4KGuTMorsTQHhGBzBkMun4iDFas the Script ID. This will find the Google OAuth2 Lib. Select the latest version and save. - Go to Project Properties from the file menu and make a note of the Script ID. This is the ID for our new project. We will need it later.
- Open the Google API Console.
- Create a new project and name it.
- Go to Enable APIs and Services and find the Fitness API.
- Go to Keys and create an OAuth Client ID. While creating the consent screen, only add the product name. Select “Web Application” in the application type. In the redirect URL add
https://script.google.com/macros/d/{SCRIPTID}/usercallbackand replace the{SCRIPTID}with the Script ID copied in step 3. Note down the client id and client secret created at the end. We will use these in our script. [You can read more on Setting up OAuth 2.0.]
Update: 28th July
The script stops working after a few days. This has happened twice with me. I get the following error:
Error: Access not granted or expired.
Service_.getAccessToken
@ Service.gs:518
I still haven’t found the solution, but I have a few leads:
- I hypothesise that it is related to oauth2 details being stored in the Properties Service. The token is empty when I print the Properties.
- This Properties Store has an expiry (likely 1 hour). I couldn’t find a way to update the oauth2 details before the expiration. Tried multiple ways after deleting and setting. This SO answer didn’t help either.
End of the Update


Code
In this section, I will discuss the coding involved. You can skip to the next section for the dashboard.
Here is how the code flow is:
- Get today’s date.
- Get all the specified metrics for the date. I care about the following specific events: step count, weight, heart points, and all logged activities.
- Step counts:
com.google.step_count.delta - Weight:
com.google.heart_minutes - Heart Points:
com.google.weight.summary - All logged activities:
com.google.activity.segment
- Step counts:
- Set the precision of all the numbers and impute null values with zero.
- Get the spreadsheet object using
getActiveSpreadsheet()and append the data on the last empty row usinggetLastRow(). - Copy the cell formatting of all the cells from the row before using the
copyTo(destination, options)function. - Copy the rolling avg. formulae from the row before, again using the
copyTo()function.
Google Fit API
It is dense! Extending it to my signals required scouring over the docs and multiple SO answers.
The first helpful link was: Users.dataSources: list. It gave me all the data points I can ask for from the Fit API. The next challenge was discovering the schema and what different fields meant. After several hit-n-trials, I found the Activity Types page. It gave me the required ID for each activity.
Update: 28th July: I stumbled upon the guide to the REST API of Fit.
I hope you will find these links useful.
Next Features
There are two immediate hurdles I need to cross.
I have to authorize the app every day to call the API. A quick search told me that the token expires after an hour. I have to use a parameter called expires_in to refresh the token. Unfortunately, I could not figure out how to use it.
Similarly, I have to call the function daily (by pressing a button from the menu). I can automate it through the time-driven (clock) trigger [ref: triggers]. The problem is the token expiration. The trigger will fail the next day because the token is stale.
Fitness Dashboard
Time for the final results.
Google Fit gives you a Heart Point (HP) for each minute of activity you do. Here is how mine looks. My heart points mainly include walking, working out, and a little bit of swimming.

The red line is an aggregated line to make it easy to see the trend.
The yellow-shaded regions highlight the days I was workationing. During these days, my heart points rarely reached zero. Whereas in the non-shaded periods, I frequently hit zero. Those zeroes are my two rest days after five days of working out.
My heart points are also cyclic in nature. Whenever I am home, my only regular activity is exercising with a two-day break every week. Walking becomes an occasional affair.
Let’s look at these heart points more closely.
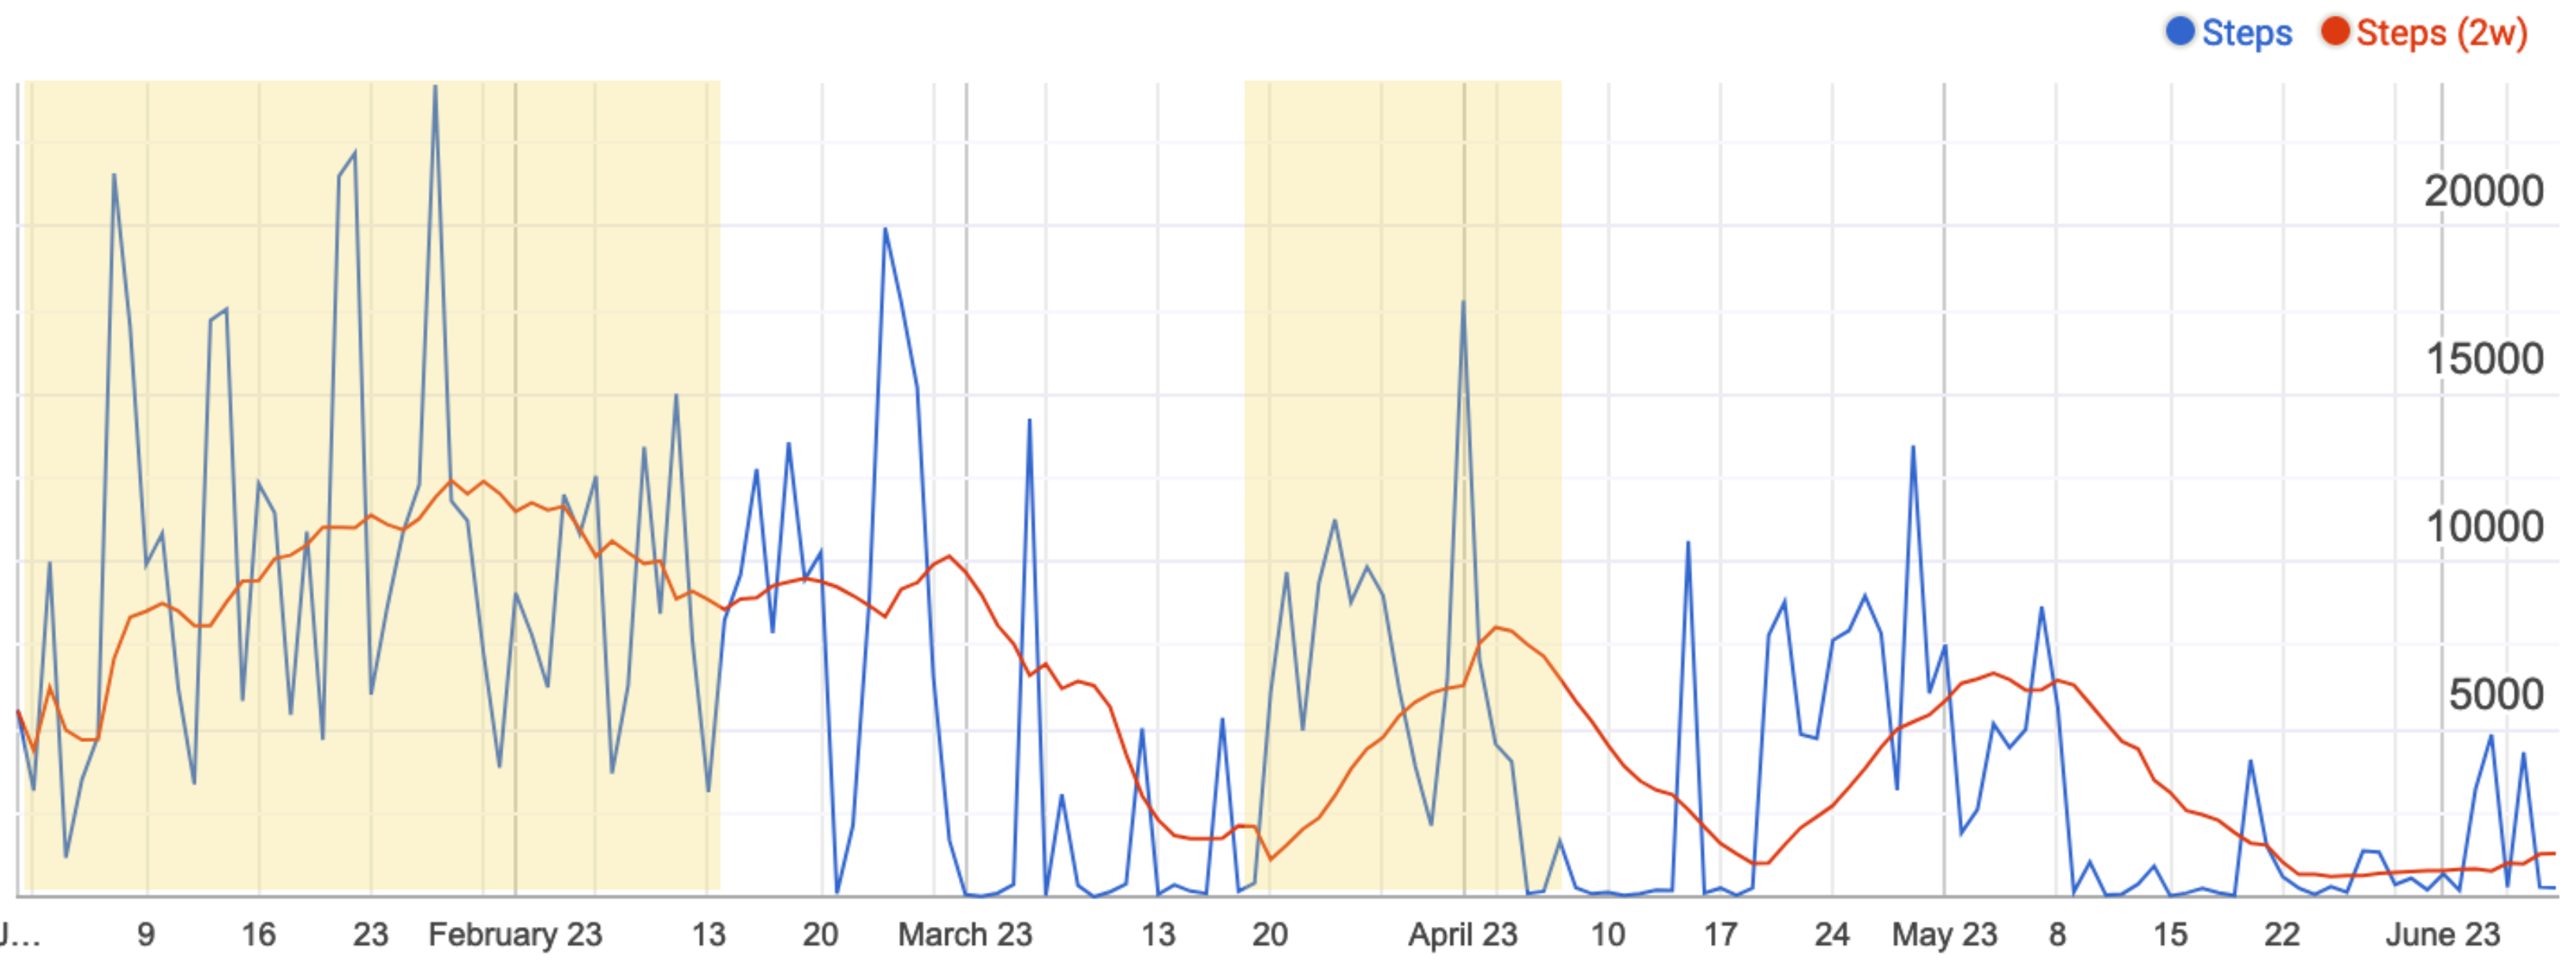
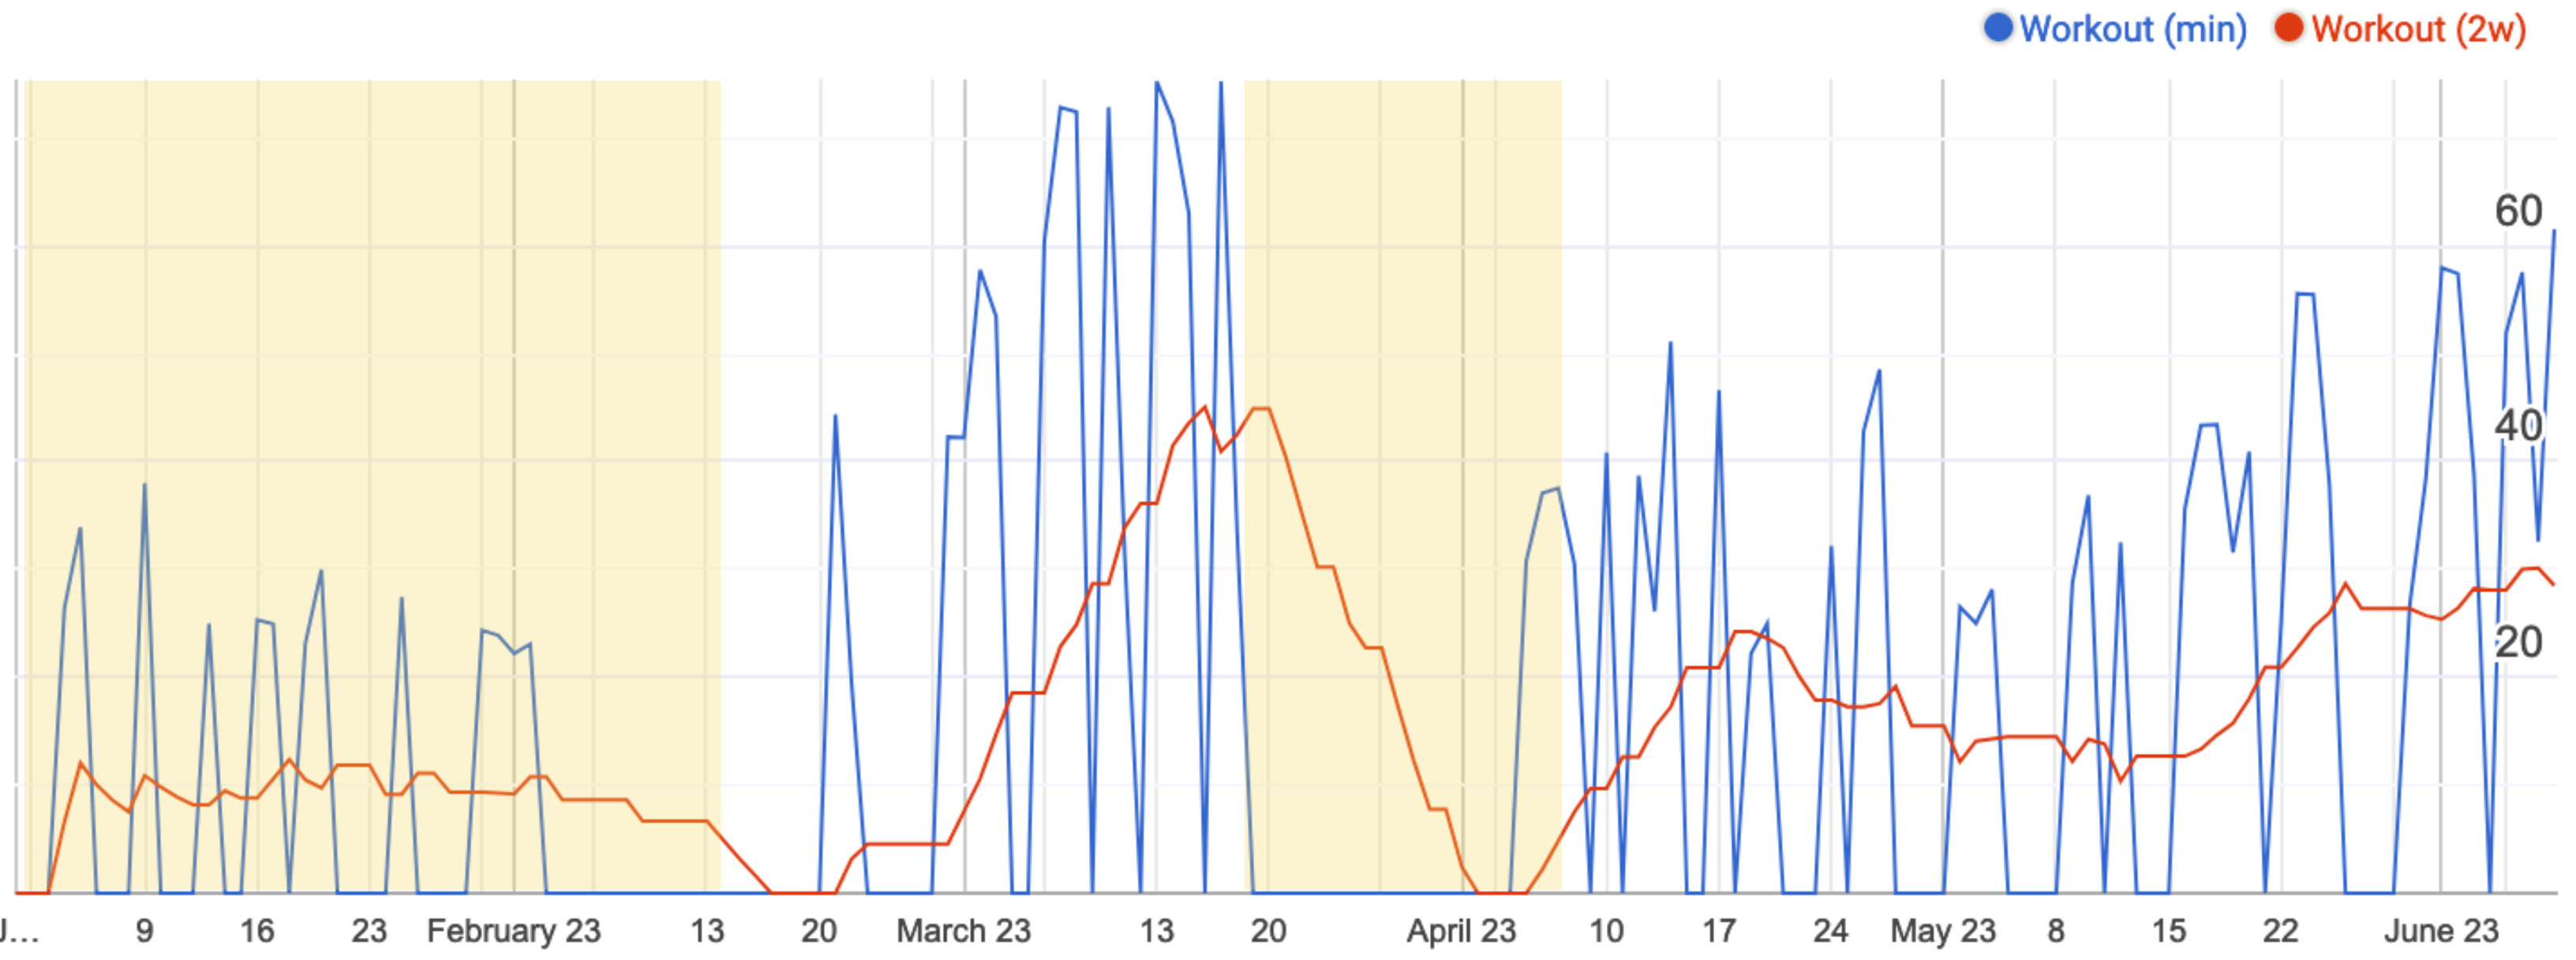
Can you notice the complementary nature of the two graphs? First, look at the red line and then focus on blue.
During the travel period, my HP fluctuated because of the crazy number of daily steps (a proxy for walking) and irregular/short workouts. And when I am at home, I go crazy with my exercise. During May, a few things at home led to more walking and small and irregular workouts.
That’s the end of my DMWL version of the Fitness dashboard.
Next Steps
The first stage of my dashboard is complete. I will iteratively update it to get more out of it. I discussed the tech improvements in the coding section. As a part of my fitness tracking journey, here is what I want to do.
I want to come up with some standards or thresholds for myself. It could mean saying something like reaching 30-40 HP daily or working out for fifty minutes five days a week. I do not know what these standards will look like.
I want to use this dashboard to motivate myself. It can be a tracker for fitness-related habits. It should all be automated. Consequently, I want this dashboard to help me inculcate new fitness-related habits. Towards this vision, the next step is to add more activities to the mix, namely meditation, cycling, and swimming.
I live a healthy lifestyle. Another goal of this dashboard is to observe how different decisions in my life impact my health and productivity. That will help me course correct. Some directions are:
- What is the impact of my diet on my weight? For example, when does a high-calorie diet typically reflect in my physique? The current heuristic-based answer is two weeks but needs validation from data.
- Sleeping hour vs the workout efficiency the next day. Does routine matter? If yes, how and where?
- How does my fitness change during my travels?
- Does fitness impact my productivity?
There are more, but these are the important ones in my mind.
Update: 19th July: I added meditation and cycling under the activities section. In the nutrition section, I added calories burnt and water intake. Calories burnt is Fit’s approximation. The water intake is tracked manually in the app like the activities.